 SEO & Accessibility
 AI
AI Localization
 Ecommerce
 Forms
Forms Fields
 Development
 Security
 Templating
 Performance
 Control Panel
 Widgets
 Assets
 Utilities
 Mailer Adapters
 Social Networking
 Integrations
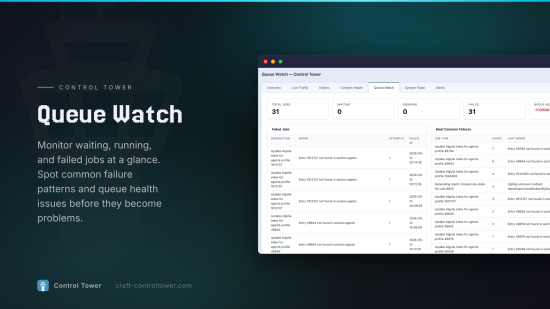
Live operational monitoring dashboard for Craft CMS 5. Know what's happening on your site right now and what needs attention.
Features
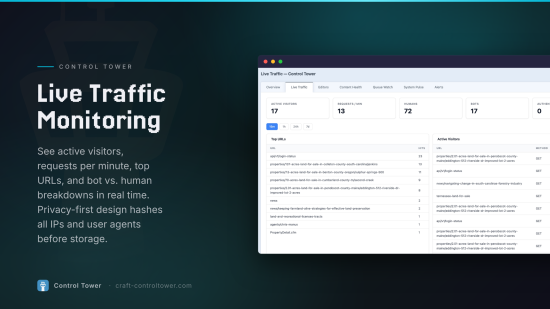
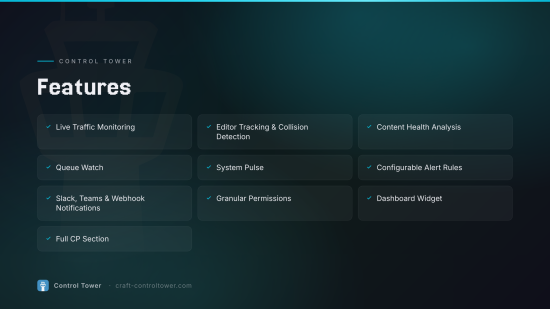
- Live Traffic — Active visitors, requests per minute, top URLs, bot vs human breakdown
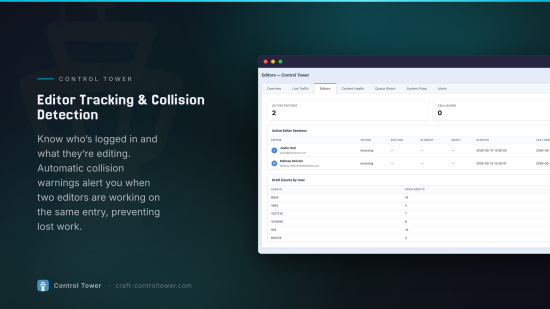
- Editor Tracking — Who's logged in, what they're editing, collision warnings when two editors work on the same entry
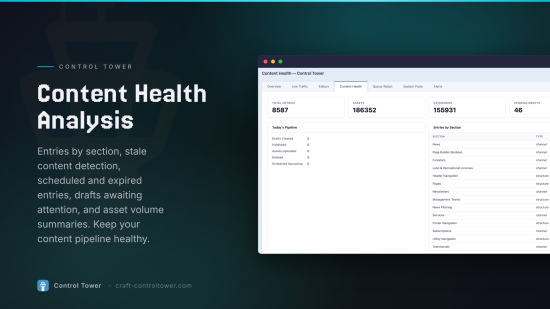
- Content Health — Entries by section, stale content detection, scheduled/expired entries, drafts awaiting attention, asset volume summaries
- Queue Watch — Waiting/running/failed jobs, common failure patterns, queue health status
- System Pulse — CPU, memory, disk, load average, DB response time, PHP info, uptime
- Configurable Alert Rules — Build alerts in the CP, no config files. Each rule has a metric, operator, threshold, severity, and enable toggle. Queue failures, editor collisions, and server resource spikes ship as default rules — edit, disable, or add your own. An extensible metric registry covers queue depth, CPU / memory / disk %, collisions, active editor count, and stale content.
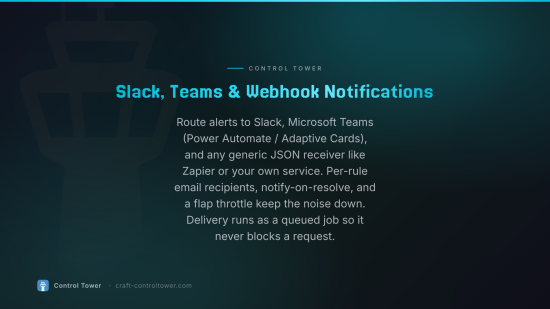
- Webhook & Email Notifications — Send alerts to Slack, Microsoft Teams (Power Automate / Adaptive Cards), Zapier, or any JSON receiver. Per-rule email recipients with admin-notify toggle. A Send Test button verifies delivery before you ship the rule. Flap throttling (
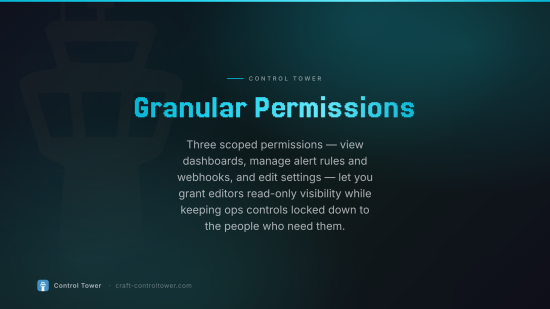
minNotifyInterval) suppresses noisy repeats, and "notify on resolve" closes the loop. Notifications dispatch asynchronously via a queue job so SMTP / webhook latency never blocks a request. - Granular Permissions — Three CP permissions (
viewDashboard,manageAlerts,manageSettings) so editors and ops staff get scoped access without full admin rights. - Overrideable Email Template — Drop a
templates/_cp/_emails/alert.twiginto your project to fully customize alert emails. - Dashboard Widget — Configurable at-a-glance summary card with auto-refresh
- Full CP Section — Seven-tab deep dive (Overview, Live Traffic, Editors, Content Health, Queue Watch, System Pulse, Alerts) plus Alerts → Rules and Webhooks management screens
Requirements
- Craft CMS 5.0 or later
- PHP 8.2 or later
Tracking
| Setting | Default | Description |
|---|---|---|
| Track Visitors | On | Enable front-end visitor tracking via request logging |
| Track Editors | On | Track CP user activity and element editing |
| Track Server Metrics | On | Periodically sample CPU, memory, disk, and DB metrics |
| Collision Detection | On | Alert when multiple editors work on the same content |
Refresh & Timeouts
| Setting | Default | Description |
|---|---|---|
| Refresh Interval | 30s | How often the dashboard auto-refreshes |
| Visitor Timeout | 2 min | Minutes before a visitor is considered inactive |
| Editor Timeout | 5 min | Minutes before an editor session is considered inactive |
Data Retention
| Setting | Default | Description |
|---|---|---|
| Visitor Data | 30 days | |
| Editor Data | 90 days | |
| Content Events | 90 days | |
| Metric Samples | 30 days | |
| Alert History | 90 days |
Alert Thresholds
| Setting | Default | Description |
|---|---|---|
| Queue Failure Threshold | 3 | Failed jobs before triggering an alert |
| 5xx Error Rate | 10/min | Errors per minute before alert |
| 404 Spike | 50/min | 404s per minute before alert |
| Stale Content | 90 days | Days without update before flagging |
Scheduled Jobs
Control Tower includes three queue jobs that should be run on a schedule via cron:
# Collect server metrics (every 1-2 minutes)
php craft queue/push justinholtweb\\controltower\\jobs\\CollectMetricsJob

# Run alert checks (every 5 minutes)
php craft queue/push justinholtweb\\controltower\\jobs\\RunAlertChecksJob

# Data retention cleanup (daily)
php craft queue/push justinholtweb\\controltower\\jobs\\CleanupJob
Or push them programmatically:
use justinholtweb\controltower\jobs\CollectMetricsJob;
use justinholtweb\controltower\jobs\RunAlertChecksJob;
use justinholtweb\controltower\jobs\CleanupJob;

Craft::$app->getQueue()->push(new CollectMetricsJob());
Craft::$app->getQueue()->push(new RunAlertChecksJob());
Craft::$app->getQueue()->push(new CleanupJob());
Dashboard Widget
Add the Control Tower widget to any user's dashboard. The widget is configurable:
- Toggle visibility for each panel (visitors, editors, queue, server, alerts, content, top URLs)
- Set a custom refresh interval
- Resize to any column span
The widget links to the full CP section for deeper investigation.
Architecture
Plugin.php              → Event wiring, CP nav, settings
controllers/
  DashboardController   → 8 CP page actions
  ApiController         → 8 JSON endpoints for live polling
services/
  VisitorTrackingService   → Session-hash tracking, bot detection
  EditorTrackingService    → CP route parsing, collision detection
  ContentHealthService     → Stale/scheduled/expired content, pipeline
  QueueMonitorService      → Queue health, failed jobs
  MetricsCollectorService  → CPU/memory/disk/DB, cross-platform
  AlertService             → Alert lifecycle, automated checks
records/                → ActiveRecord models (6 tables)
migrations/Install.php → Database schema
jobs/                   → CleanupJob, CollectMetricsJob, RunAlertChecksJob
widgets/                → Dashboard widget
assets/                 → CSS + JS with auto-refresh polling
templates/              → CP section (7 tabs) + widget
Privacy
- Visitor IP addresses are stored as SHA-256 hashes, never in plain text
- User agents are hashed for bot detection grouping
- Session identity uses a daily-rotating hash of IP + user agent
- All tracking data is automatically purged based on retention settings
- Visitor tracking can be fully disabled in settings
Roadmap
v1.5 — Trend charts (15m / 1h / 24h / 7d), per-section content health, 404 and error rate trends, configurable alert thresholds
v2 — Deployment awareness (git SHA, last deploy, environment), cache metrics, database slow query panel, multi-site comparisons
Standard
Plus $25/year after one year.
To install this plugin, copy the command above to your terminal.
This plugin doesn't have any reviews.